| Ordered power tab |
Calculating, by the algorithm, values of: optimal power level, power level without penalties and safe power level |
Possible reduction of the costs for ordered power |
| Boot profiles |
Recording boot profiles |
Avoidance of exceeding ordered power during facility start-up |
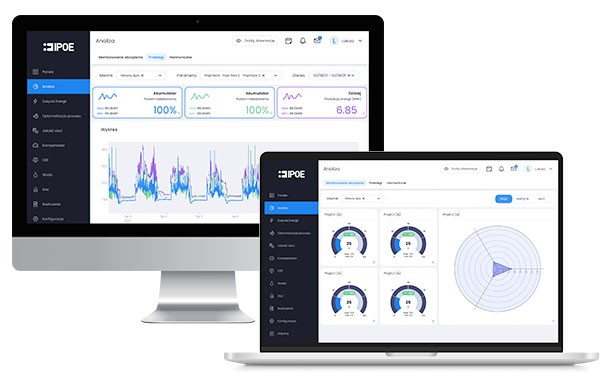
| Energy profiles |
Selection of active power waveform from any period of time for comparison purposes |
Possibility to compare active power utilization, in different periods of time, on a weekly basis |
| Electrical network anomalies monitoring |
In the alarm log, there are records related to the occurring events, e.g. dips, declines, increases |
The ability to track events on the grid that are related to the quality of supplied energy |
| Waveforms monitoring |
The user has the option to perform an analysis using multiple data from various sources on the timeline |
The correlation of events gives us the opportunity to detect dependencies in the process, which may reduce costs, e.g. by better understanding the process |
| Reactive power monitoring |
The platform presents records related to the course of inductive and capacitive reactive power, tg Φ, cos Φ |
Avoidance of penalties for reactive power and exceeding tg Φ, possibility of optimization |
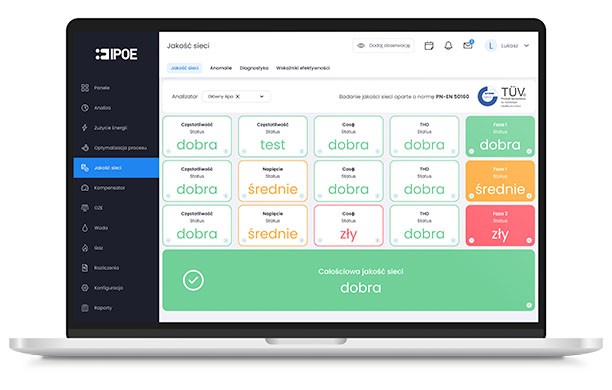
| Harmonics monitoring |
Analyze the harmonics of both voltages and currents |
Avoid damage to the equipment and devices |
| Load monitoring |
Real-time monitoring of many parameters, e.g. current and voltage asymmetry |
Application of a uniform load on individual phases, maximum use of the available load with even distribution |
| Efficiency indicators |
Ability to use predefined performance indicators |
User receives selected information in one place in form of an easy to use array |
| Power guard |
User receives information about the usage of the ordered power and the prediction of power usage in next 15 minutes |
Avoidance of charges for exceeding ordered power. Very important, especially during summer |
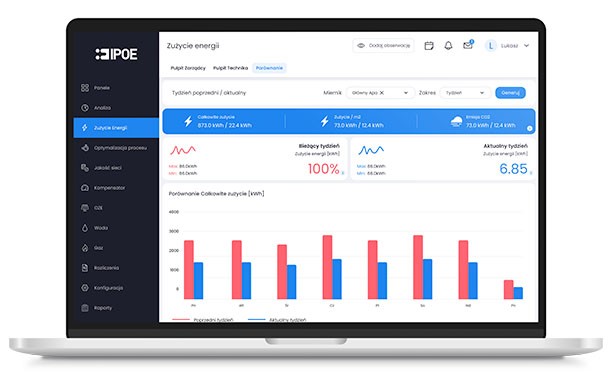
| Energy usage tab |
The manager has access to selected period of time in terms of energy consumption. He can correlate data with the current production status and relate to the number of employees on a given shift |
We gain the possibility of optimal use of the staff resources depending on the production plan. The profit consists in reducing the number of employees at a time when production does not require so much workload |
| Energy consumption comparison |
The operator gets charts where he can compare different periods of time in case of energy consumption, e.g. the current and previous week, month or the billing period |
Constant monitoring and data comparison |
| General tasks tab |
Enter tasks on the timeline, e.g. injection molding machine overview |
Ability to plan services and inspections. You have everything in one place, you do not have to switch between other calendars, save your time |