APA solution
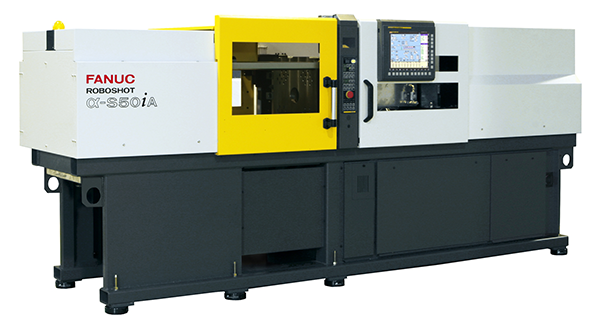
FANUC ROBOSHOT is an all-electric injection molding machine, designed for the most advanced production processes in injection technology. Compared to traditional hydraulic, electric and hybrid injection molding machines is considerably better when it comes to energy consumption. But, as it turns out, individual elements of the machine use this Energy in varying degrees and it is worth monitoring these parameters considering conscious and responsible process management. Undoubtedly, energy costs must be managed wisely, especially when it comes to a device as advanced as FANUC, in which the company invests a lot of capital. Therefore, conducting the measurement is justified.
Our approach
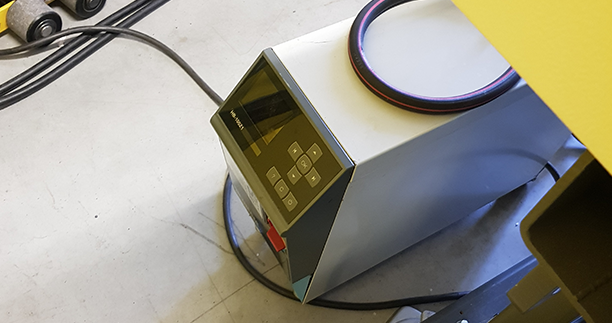
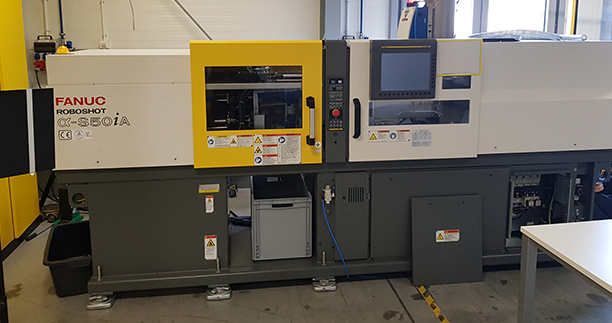
The measurement was carried out on a FANUC injection molding machine - model S50iA - along with peripheral devices, which included: a thermostat, a granulate feeder, a granulate dryer and a system of heaters.
To illustrate the energy consumption of the device and peripherals, we used the NAZCA platform, which provides the client with information about current and archived data related to energy consumption.
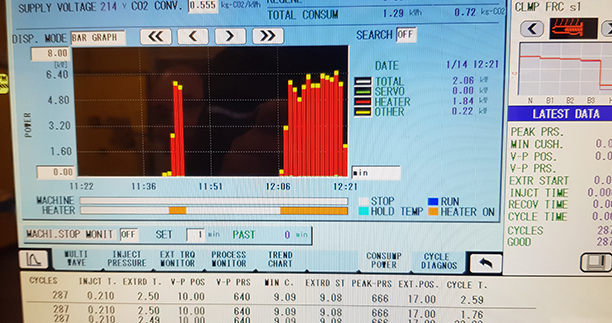
We wanted our flagship platform to be clear and intuitive for the client. Already on the first screen, the user has access to basic information about active power (given in kW) from the individual elements, that have been measured. Further information can be found in the individual tabs.
What does the client gain thanks to metering using the NAZCA platform?
In the system, the customer can check the power supply in general, taking into account voltages, active and reactive powers. It is also possible to monitor energy-related indicators (charts, calculations, digital signals). The operating status of the injection molding machine can be monitored in real time.
There is also a total active power indicator available, which shows minimum, maximum and average value of the achieved active power. The active power of the injection molding machine can also be monitored "live". In addition, total active energy in kWh and energy consumption with a distinction between the individual peripheral devices is also available. Such wide possibilities of the platform give full insight into the operation of devices.
On the charts, it is possible to independently determine the time ranges, including those from the past, and to filter out individual variables (e.g. only a selected power phase) - this way you can check how the energy demand has developed over a longer period. Each chart can be conveniently exported to a CSV file in Excel.
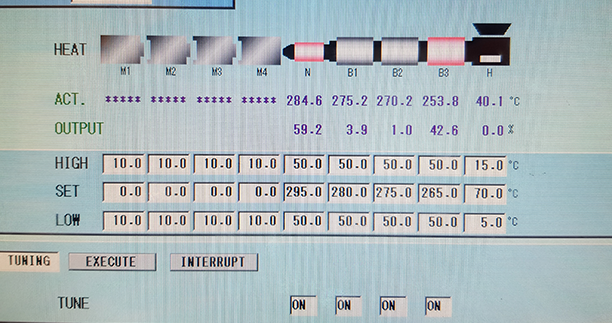
We also made sure that the interface was standardized and that the data in the system relate to the actual designations: the heaters are numbered and presented as they look in the injection molding machine itself - so the operator can refer to the correct number of the heater in the machine.
Interesting values from the customer's perspective can be seen in the tab with power system. Voltage-related indicators are available, along with a reference to the standard with the maximum and minimum allowable voltage value. The user can therefore check whether his measurements are oscillating within the normalized values.
From our charts it is possible to conclude, which part of the injection molding machine consumes a lot of energy in a given phase. For example - as our analysis shows - the thermostat consumes a lot of it, and the greatest power spikes occur at start-up. On the other hand, the feeder generates low energy consumption. This is an important conclusion from the customer's perspective, which can thus make strategic decisions beeing more awared.
Our flagship platform also supports the management of electricity expenses. The main circuit tab shows the energy costs for the previous day, week or the current month. The user can independently enter the current rate per kWh, and the system automatically recalculates all values.
The client also has access to the IPOE platform. Therefore, within one environment it is possible to work on several different systems for metering.
Technologies used
The following system capabilities were used:
- collecting complete data on the energy consumption of the FANUC main device, including its peripheral elements;
- determining time ranges for the data and for specific parameters;
- real-time monitoring;
- clear and readable interface;
- the ability to export data to Excel;
- synchronization with the IPOE platform.